


Data is based on 40 alumni since 2012.
Retention Rates | Graduation Rates | Student Learning Outcomes
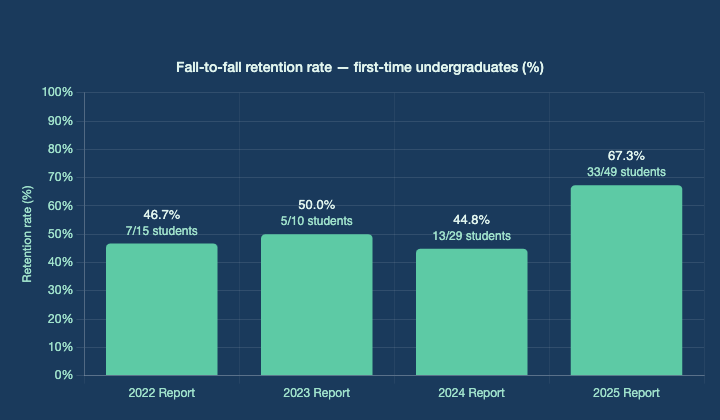
Fall-to-Fall Retention Rate
The following data is based on students who attended college for the first time in the fall. BCCS’s retention rate goal is 60% or greater.
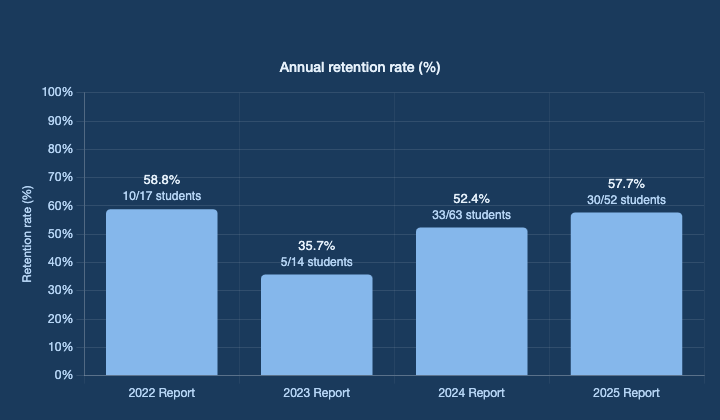
Annual Retention Rate
Bridges Christian College & Seminary’s annual retention rate is 57.7%.
Graduate Employment and Achievement
Bridges Christian College & Seminary’s Graduate Employment/Achievement Rate for ministry positions or graduate school is 87%.
Employment Data

BCCS desires to have at least a 75% employment/achievement rate.
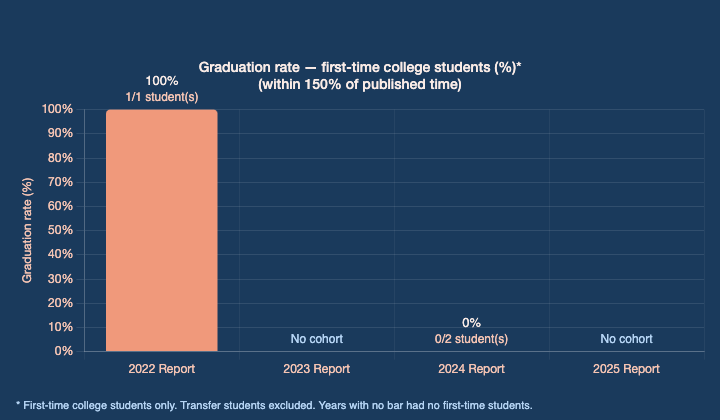
Graduation Rates
The following data is based on new students who attended college for the first time in the fall trimester.
Exam Data
ABHE Exam Performance
Institutional Norm Exit Exam Score: 79.5%
National Norm (other schools): 62.19%
Institutional Norm Entrance Exam Score: 61%
*Data from before 2020–21 academic year.
Debt-Free Initiative
Since launching the Debt-Free Degree Initiative in 2016, 100% of graduates have completed their degrees without student debt.
Student Learning Outcomes
Select the link below for information about student achievement of learning outcomes.